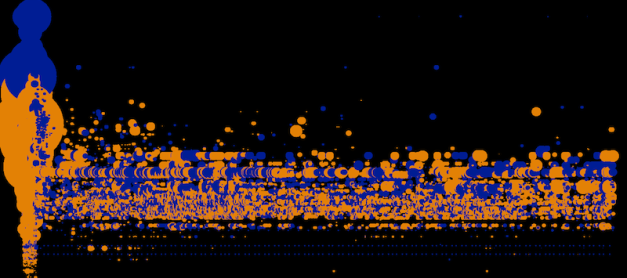
Design and technology studio Stamen visualized financial transactions of buy and sell data on NASDAQ during a single day. What’s interesting about this visualization is the density of information that is captured within the dataset and the use of our pattern recognition capabilities to see repetitions and outliers of such a dense set of data. http://content.stamen.com/visualizing_a_day_of_financial_transactions_on_nasdaq http://content.stamen.com/visualizing_a_day_of_financial_transactions_on_nasdaq_part_2 For each transaction they mapped: time of the transaction, to the second whether it was buy or sell price of …
Monthly Archives: May 2013
Packetloop
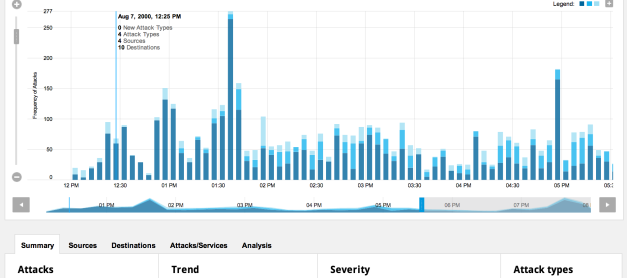
Packetloop is a tool to analyse network traffic through data visualization. It inspects every packet, conversation, protocol and file to find threats and variations from normal traffic. It doesn’t visualize live data rather it is build on file uploads. There are four different ways Packetloop represents the data, by threats, sessions, protocols and files by location. But so far only the threats visualization works.


