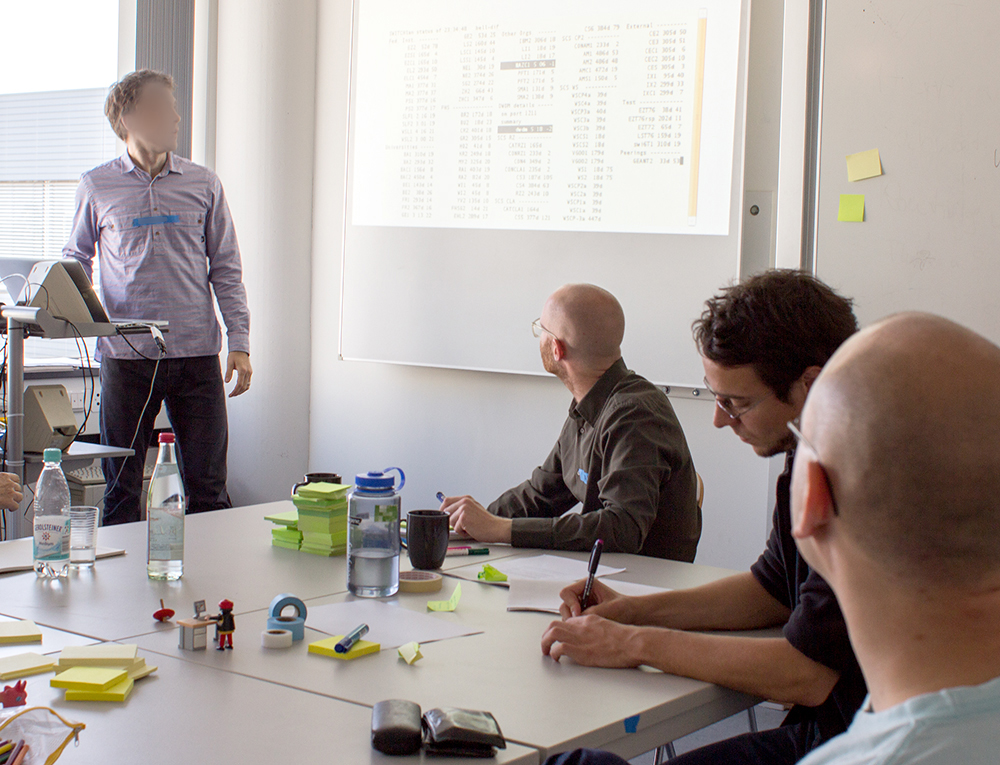
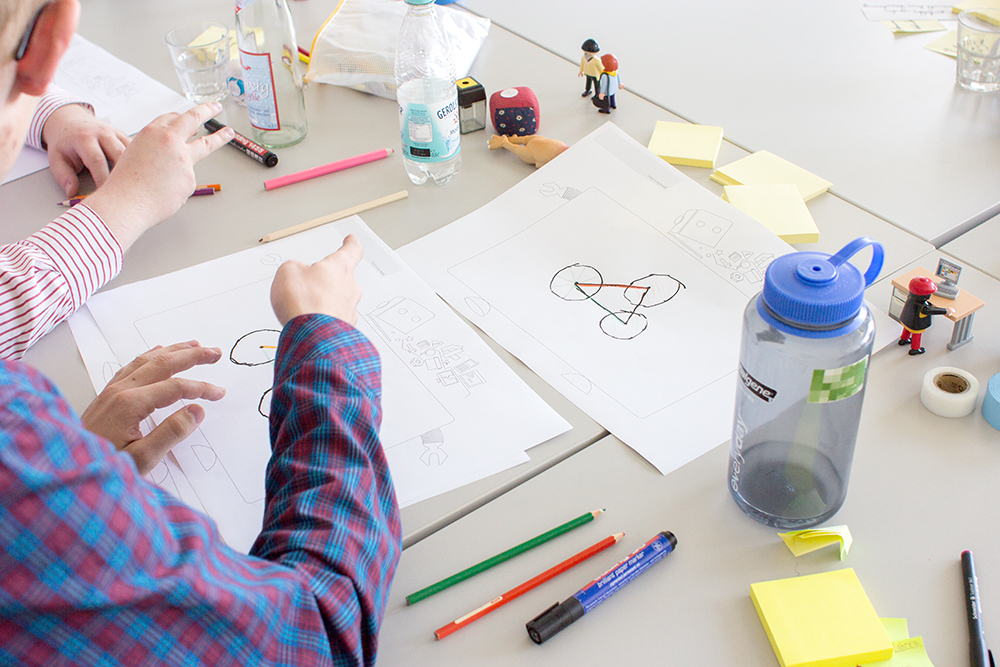
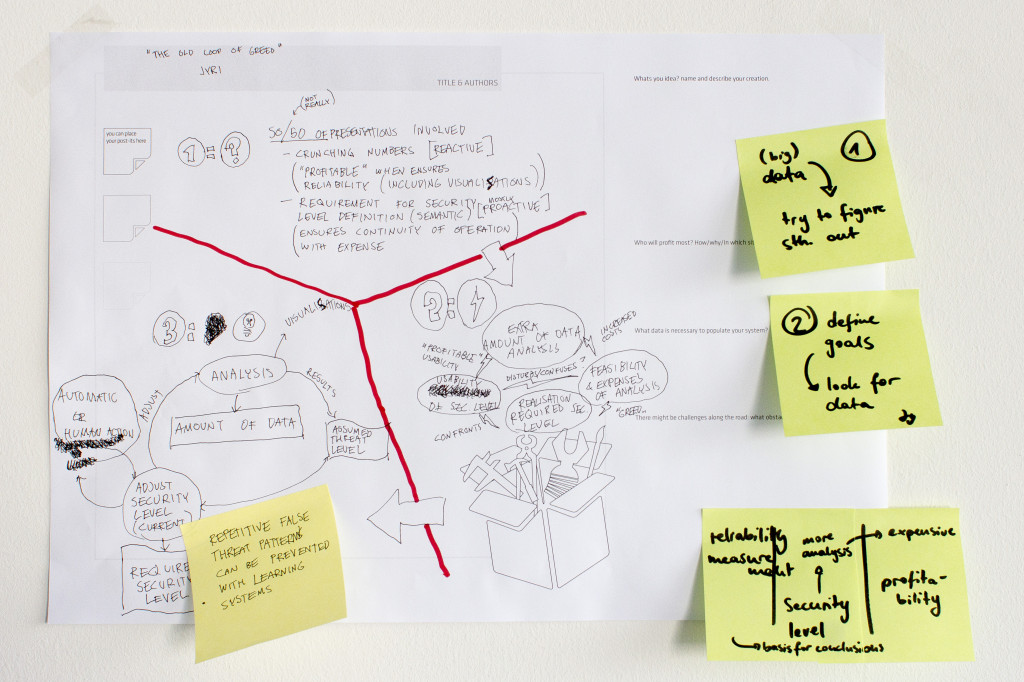
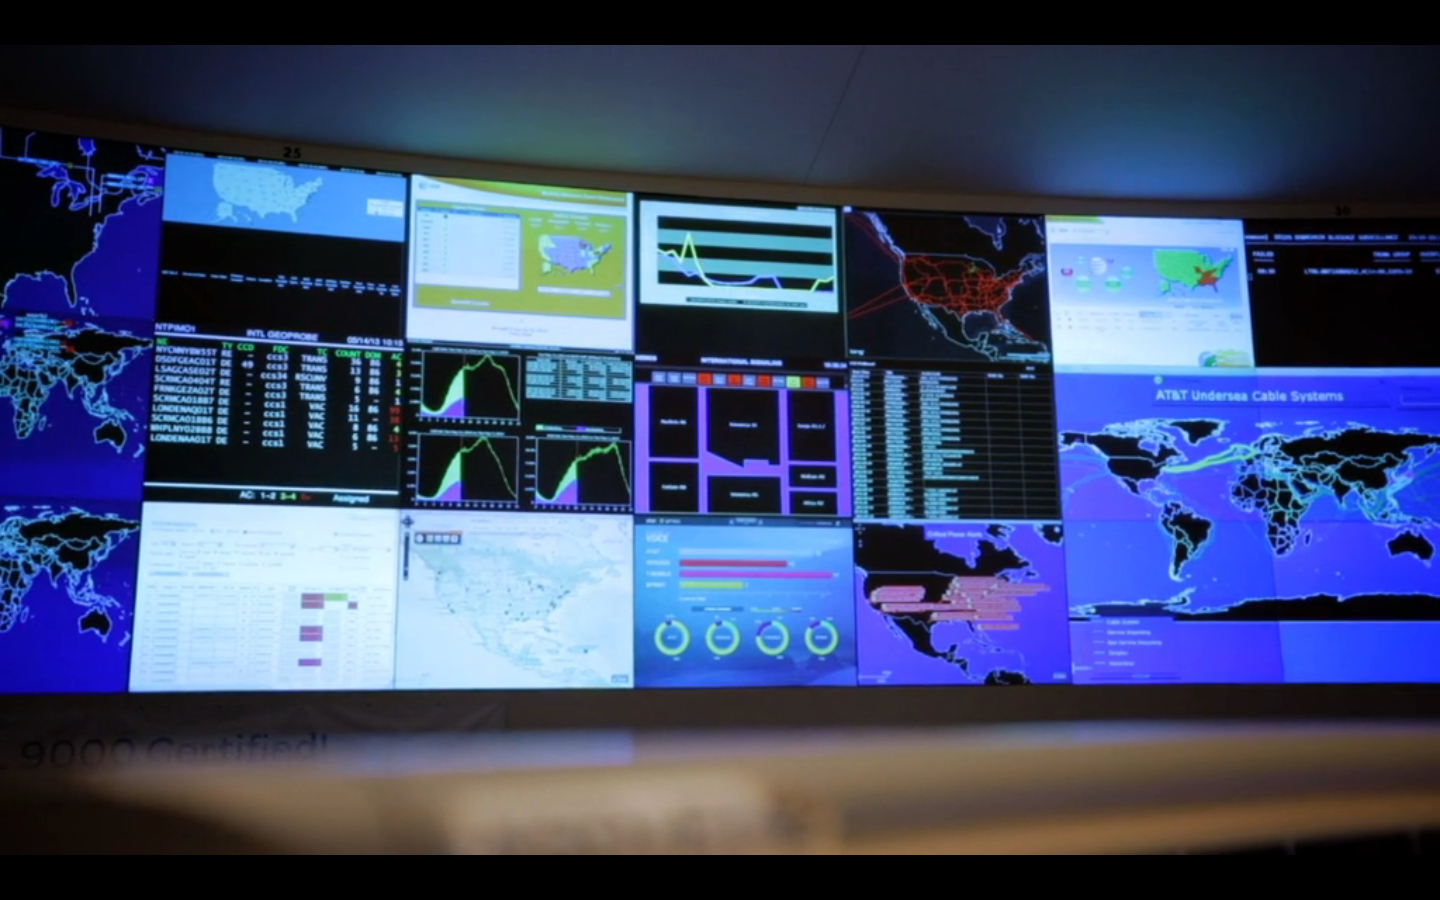
Last week we hosted a workshop on the grounds of the TU Munich to gather people from different backgrounds in network security and network operation and create an opportunity to think about new ways of visualizing data in security monitoring and analysis. We gained a lot of insights from this workshop that we are processing at the moment. We will use these together with insights from interviews, use cases provided by our partners and other insights to fire up our design process. We can already say the workshop has been a great success and we are eager to instill our newly won knowledge into visualization concepts!
Among the participants were general security experts directly working in the security work package with us in the SaSER project, like Nokia Siemens Networks, the TU Munich, the RUB (Ruhr University Bochum), the Fraunhofer AISEC or participants involved in other work packages of SaSER, like the Leibniz Supercomputing Centre. There were two students working in security monitoring at the Leibniz Rechenzentrum who were able to share their expertise in this area. We also had two guests who came all the way from Finland to take part in the workshop! They are part of the Finnish research institute VTT, comparable to the German Fraunhofer institutes.
After a short introduction round and a little warm-up exercise (People had to visualize their spendings of the last week with pen and paper and present it), Johannes gave an overview over the most important insights so far from extracted from the interviews we conducted. We had a little discussion afterwards. Main topics here were: How to evaluate security level, how to select what data to share to cooperate with other stakeholders and how to cope with large amounts of data.
After that I gave a quick overview over state-of-the-art visualizations that we found interesting for the research project for different reasons. This talk was followed by a discussion as well. The main topics here were: Filtering as an essential means for visualization to focus on a subset of data, how to visualize security metrics and decision/attack trees and how to report security stati to other stakeholders via visualizations. These topics were further investigated especially in the afternoon sessions.
As a last task before the lunch break we asked the participants to come up with the perfect machine that could handle all of the network security or administration tasks they considered important, the so-called “Utopian Machines”. For this the participants got together in groups of two and had 20 minutes to develop an idea. After that each group presented their idea quickly.
In the afternoon sessions there were two different tracks. One was called “Dashboard Kitchen”, the other “Data Picnic”. In the “Dashboard Kitchen” track people could either adjust their raw concepts from the “Utopian Machines”-session or come up with a completely new concept for a dashboard. In the “Data Picnic”-group we were looking at actual datasets that were relevant for security analysis. We talked about established workflows that are used to find out if there are particular incidents in the data and how visualization might assist in finding them more easily/efficiently. This was quite eye-opening for us because we haven’t been able so far to gain insight into the typical use cases security analysts are running through. Also, the “Dashboard Kitchen” results provided us with lots of different insights regarding the questions mentioned at the beginning as well as other issues.
The results of the workshop will be documented in more detail on this blog soon, when we’re finished with the “post-processing”.
Thanks again to all participants for taking part and bringing so much commitment to the workshop, special thanks to Lothar Braun and the TUM for letting us use their seminar rooms!


