“Time-series — sets of values changing over time” A Tour Through the Visualization Zoo http://hci.stanford.edu/jheer/files/zoo/ This description of the word “Time-Series” is very close to the explanation in Oxfords dictionary which adds that the word comes from a statistic background and often the intervals are equal within the time-series. http://www.oxforddictionaries.com/definition/english/time-series?q=time-series Within our research project we are mainly interested in the visualization part within the vast field of statistics. In the book “The Visual Display of …
Monthly Archives: October 2013
Raphael Marty on the need for more human eyes in sec monitoring
by Johannes Landstorfer
on October 16, 2013,
0 comments
Tagged with: analysis • conference • cyber-security • talk • visualization
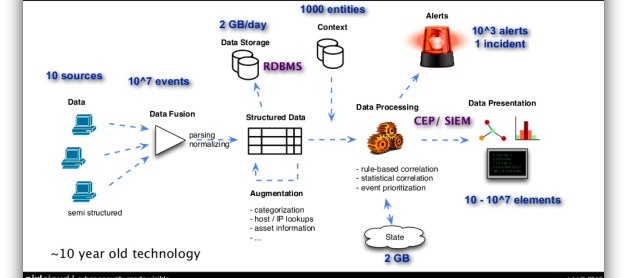
Raphael Marty spoke at the 2013 (ACM) conference for Knowledge Discovery and Data mining (KDD’13). It is a very enlightening talk if you want to learn about the status of visualization in computer network security today and core challenges. Ever growing data traffic and persistent problems like false positives in automatic detection cause headaches to network engineers and analysts today, and also Marty admitted often that he has no idea of how to solve them. …

