Raphael Marty spoke at the 2013 (ACM) conference for Knowledge Discovery and Data mining (KDD’13). It is a very enlightening talk if you want to learn about the status of visualization in computer network security today and core challenges. Ever growing data traffic and persistent problems like false positives in automatic detection cause headaches to network engineers and analysts today, and also Marty admitted often that he has no idea of how to solve them. As he has worked for IBM, HP/ArcSight, and Splunk, the most prestigious companies in this area, this likely not because of lacking expertise).
Marty also generously provided the slides for his talk.
Some key points I took away:
Algorithms can’t cope with targeted or unknown attacks – monitoring needed
Today’s attacks are rarely massive or brute force, but targeted, sophisticated, more often nation state sponsored, and low and slow (this is particularly important as it means you can’t look for typical spikes, which are a sign a mass event – you have to look at long term issues).
Automated tools of today find known threats and work with predefined patterns – they don’t find unknown attacks (0 days) and the more “heuristic” tools produce lots of false positives (i.e. increase the workload for analysts instead of reducing it)
According to Gartner automatic defense systems (prevention) will become entirely useless from in 2020. Instead, you have to monitor and watch out for malicious behaviour (human eyes!), it won’t be solved automatically.
Some figures for current data amounts in a typical security monitoring setup:
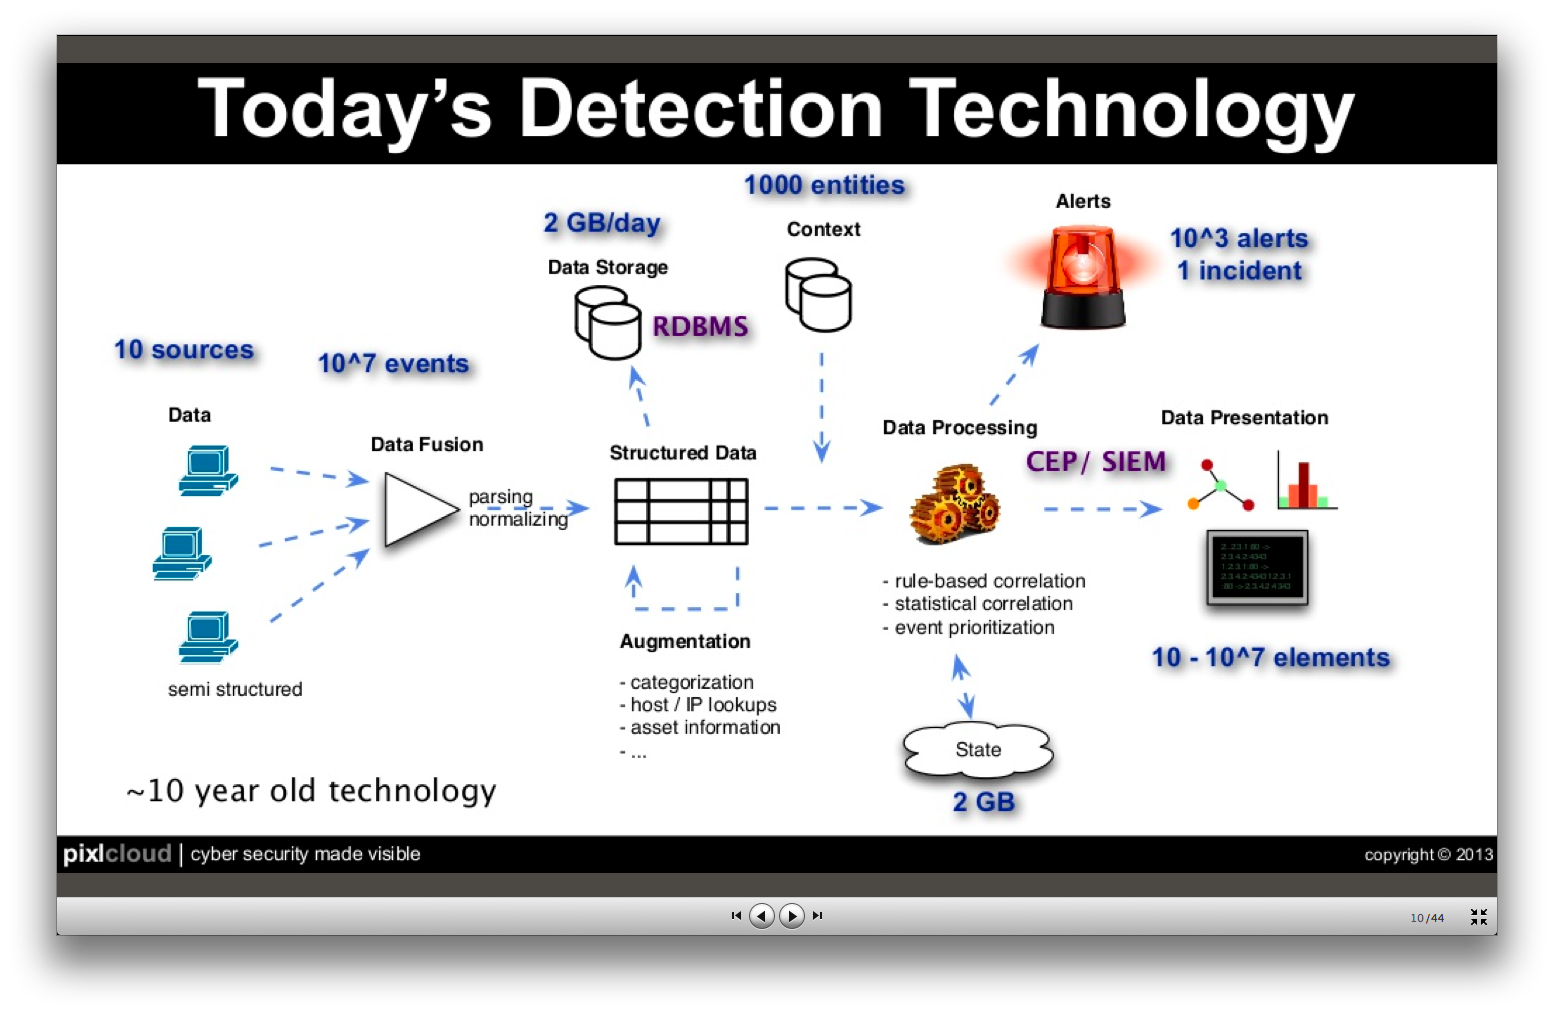
So, if everything works out nicely, you still end up with 1000 (highly aggregated/abstracted) alerts that you have to investigate to find the one incident.
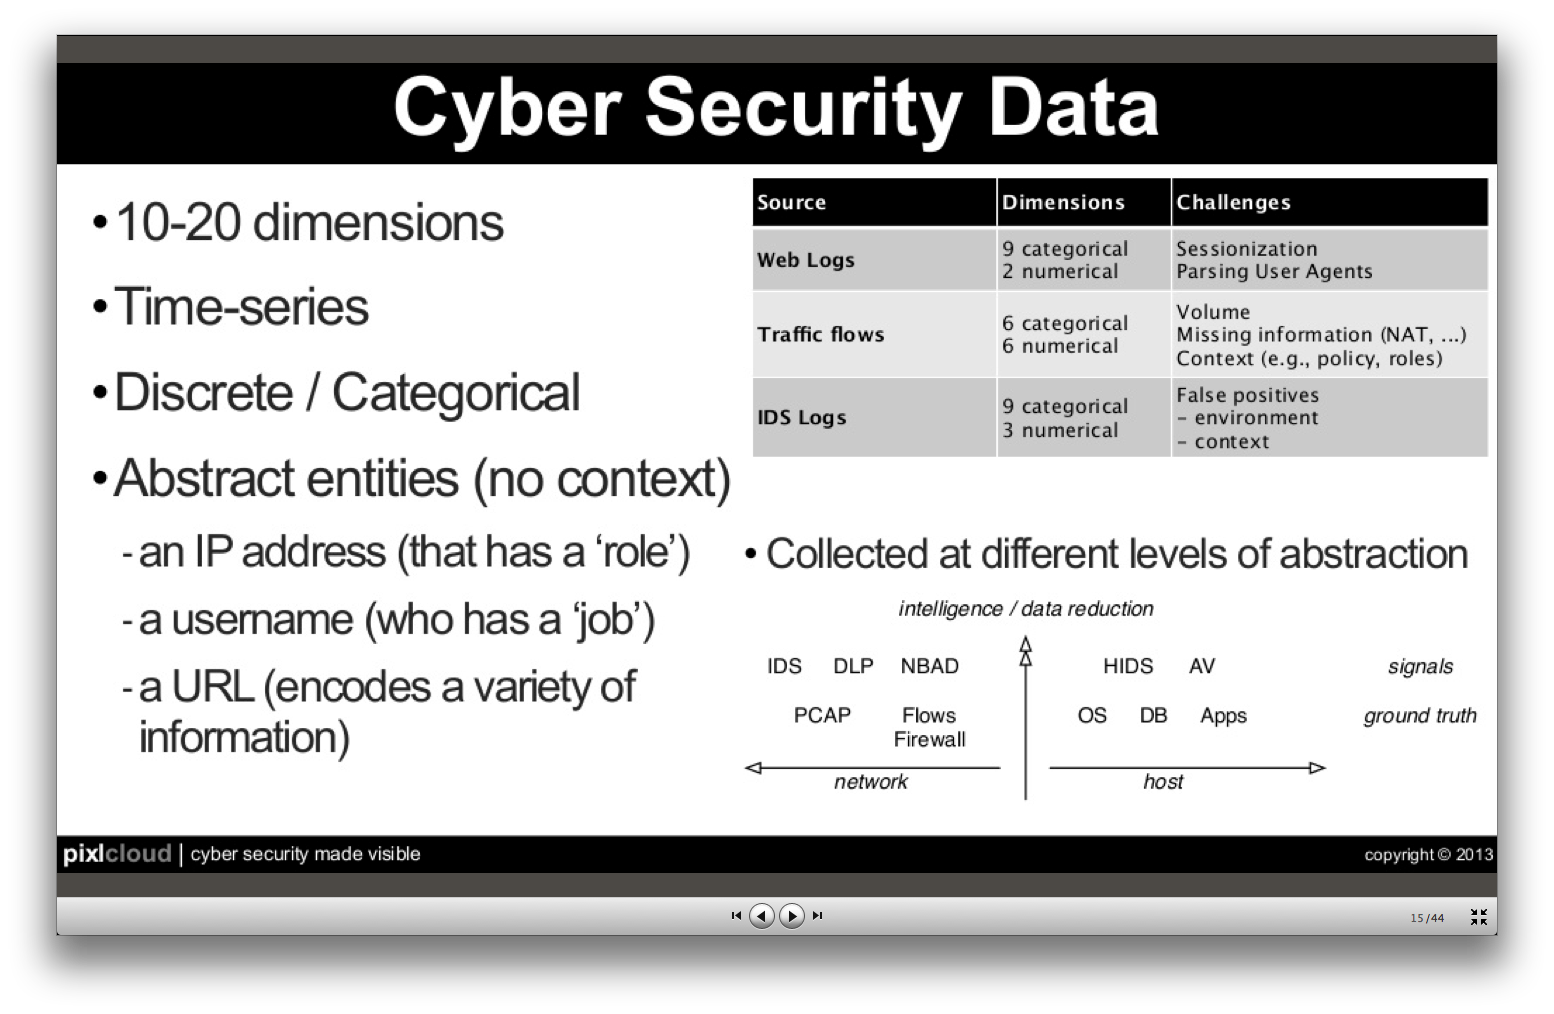
Some security data properties:
Challenges with data mining methods
- Anomaly detection – but how to define “normal”?
- Association rules – but data is sparse, there’s little continuity in web traffic
- Clustering – no good algorithms available (for categorical data, such as user names, IP addresses)
- Classification – data is not consistent (e.g. machine names may change over time)
- Summarization – disrespect “low and slow” values, which are important
How can visualization help?
- make algorithms at work transparent to the user
- empower human eyes for understanding, validation, exploration
- because they bring
- supreme pattern recognition
- memory for contexts
- intuition!
- predictive capabilities
This is of course a to-do list for our work!
The need for more research
What is the optimal visualization?
– it depends very much on data at hand and your objectives. But there’s also very few research on that and I’m missing that, actually. E.g. what’s a good visualization for firewall data?
And he even shares one of our core problems, the lack of realistic test data:
That’s hard. VAST has some good sets or you can look for cooperations with companies.