4 articles Tag conference

Raphael Marty on the need for more human eyes in sec monitoring

Raphael Marty spoke at the 2013 (ACM) conference for Knowledge Discovery and Data mining (KDD’13). It is a very enlightening talk if you want to learn about the status of visualization in computer network security today and core challenges. Ever growing data traffic and persistent problems like false positives in automatic detection cause headaches to network engineers and analysts today, and also Marty admitted often that he has no idea of how to solve them. As he has worked for IBM, HP/ArcSight, and Splunk, the most prestigious companies in this area, this likely not because of lacking expertise).

Marty also generously provided the slides for his talk.

Some key points I took away:

Algorithms can’t cope with targeted or unknown attacks – monitoring needed

Today’s attacks are rarely massive or brute force, but targeted, sophisticated, more often nation state sponsored, and low and slow (this is particularly important as it means you can’t look for typical spikes, which are a sign a mass event – you have to look at long term issues).

Automated tools of today find known threats and work with predefined patterns – they don’t find unknown attacks (0 days) and the more “heuristic” tools produce lots of false positives (i.e. increase the workload for analysts instead of reducing it)

According to Gartner automatic defense systems (prevention) will become entirely useless from in 2020. Instead, you have to monitor and watch out for malicious behaviour (human eyes!), it won’t be solved automatically.

Some figures for current data amounts in a typical security monitoring setup:

marty_detectiontechnology___slideshare-zrlram

So, if everything works out nicely, you still end up with 1000 (highly aggregated/abstracted) alerts that you have to investigate to find the one incident.

Some security data properties:

marty_securitydata___slideshare-zrlram

Challenges with data mining methods

  • Anomaly detection – but how to define “normal”?
  • Association rules – but data is sparse, there’s little continuity in web traffic
  • Clustering – no good algorithms available (for categorical data, such as user names, IP addresses)
  • Classification – data is not consistent (e.g. machine names may change over time)
  • Summarization – disrespect “low and slow” values, which are important

How can visualization help?

  1. make algorithms at work transparent to the user
  2. empower human eyes for understanding, validation, exploration
    • because they bring
    • supreme pattern recognition
    • memory for contexts
    • intuition!
    • predictive capabilities

This is of course a to-do list for our work!

The need for more research

What is the optimal visualization?

– it depends very much on data at hand and your objectives. But there’s also very few research on that and I’m missing that, actually. E.g. what’s a good visualization for firewall data?

And he even shares one of our core problems, the lack of realistic test data:

That’s hard. VAST has some good sets or you can look for cooperations with companies.

Tags: , , , ,

Best in Big Data 2013: On the relevance of user interfaces for big data


Network traffic data becomes “big data” very quickly, given today’s transaction speeds and online data transfer volumes. Consequentially, we attended the Best in Big Data congress in Frankfurt/Main, to learn about big data approaches for our, but also for other domains.


[official pix not available yet][official pix not available yet]

Most of the presntations seemed to be made by big companies to sell to other big companies. Business value of big data and how to deal with it in enterprise contexts consumed most of the slides. In a couple of statements you could hear that big data technology is now well enough understood and spread that the discussion can focus on use and business cases instead. Big data might also move away from IT departments and get closer to domain experts.

For my user experience perspective, I missed aspects like:

  • user interface: how do people get in touch with these vast amounts of data? Do they get autmatically aggregated information? How and by whom are the aggregation methods defined? Do they use visualizations (this was naturally quite important to me)? Analysis tools? How are they different to the traditional ones?
  • use cases: although there were examples of how to put big data into praxis, they were mostly presented on architecture level, with little details on user level and output examples.
  • consumer perspective: the consumer was mostly an object of analysis, and little effort was visible to empower consumer decisions through big data. A 10min exception was Sabine Haase/Morgenpost, who presented the flight route radar. As far as I understood, this project did not use big data techniques very much. It appeared as if it was the “social project” that you need to include.

Haase was also one of two women on stage and she was even acting as a substitute to her male colleagues – there were a couple of women in the audience but in principle it appeared to be a rather masculine topic or event)

There are a couple of aspects that I find worth mentioning in detail:

Better user interfaces

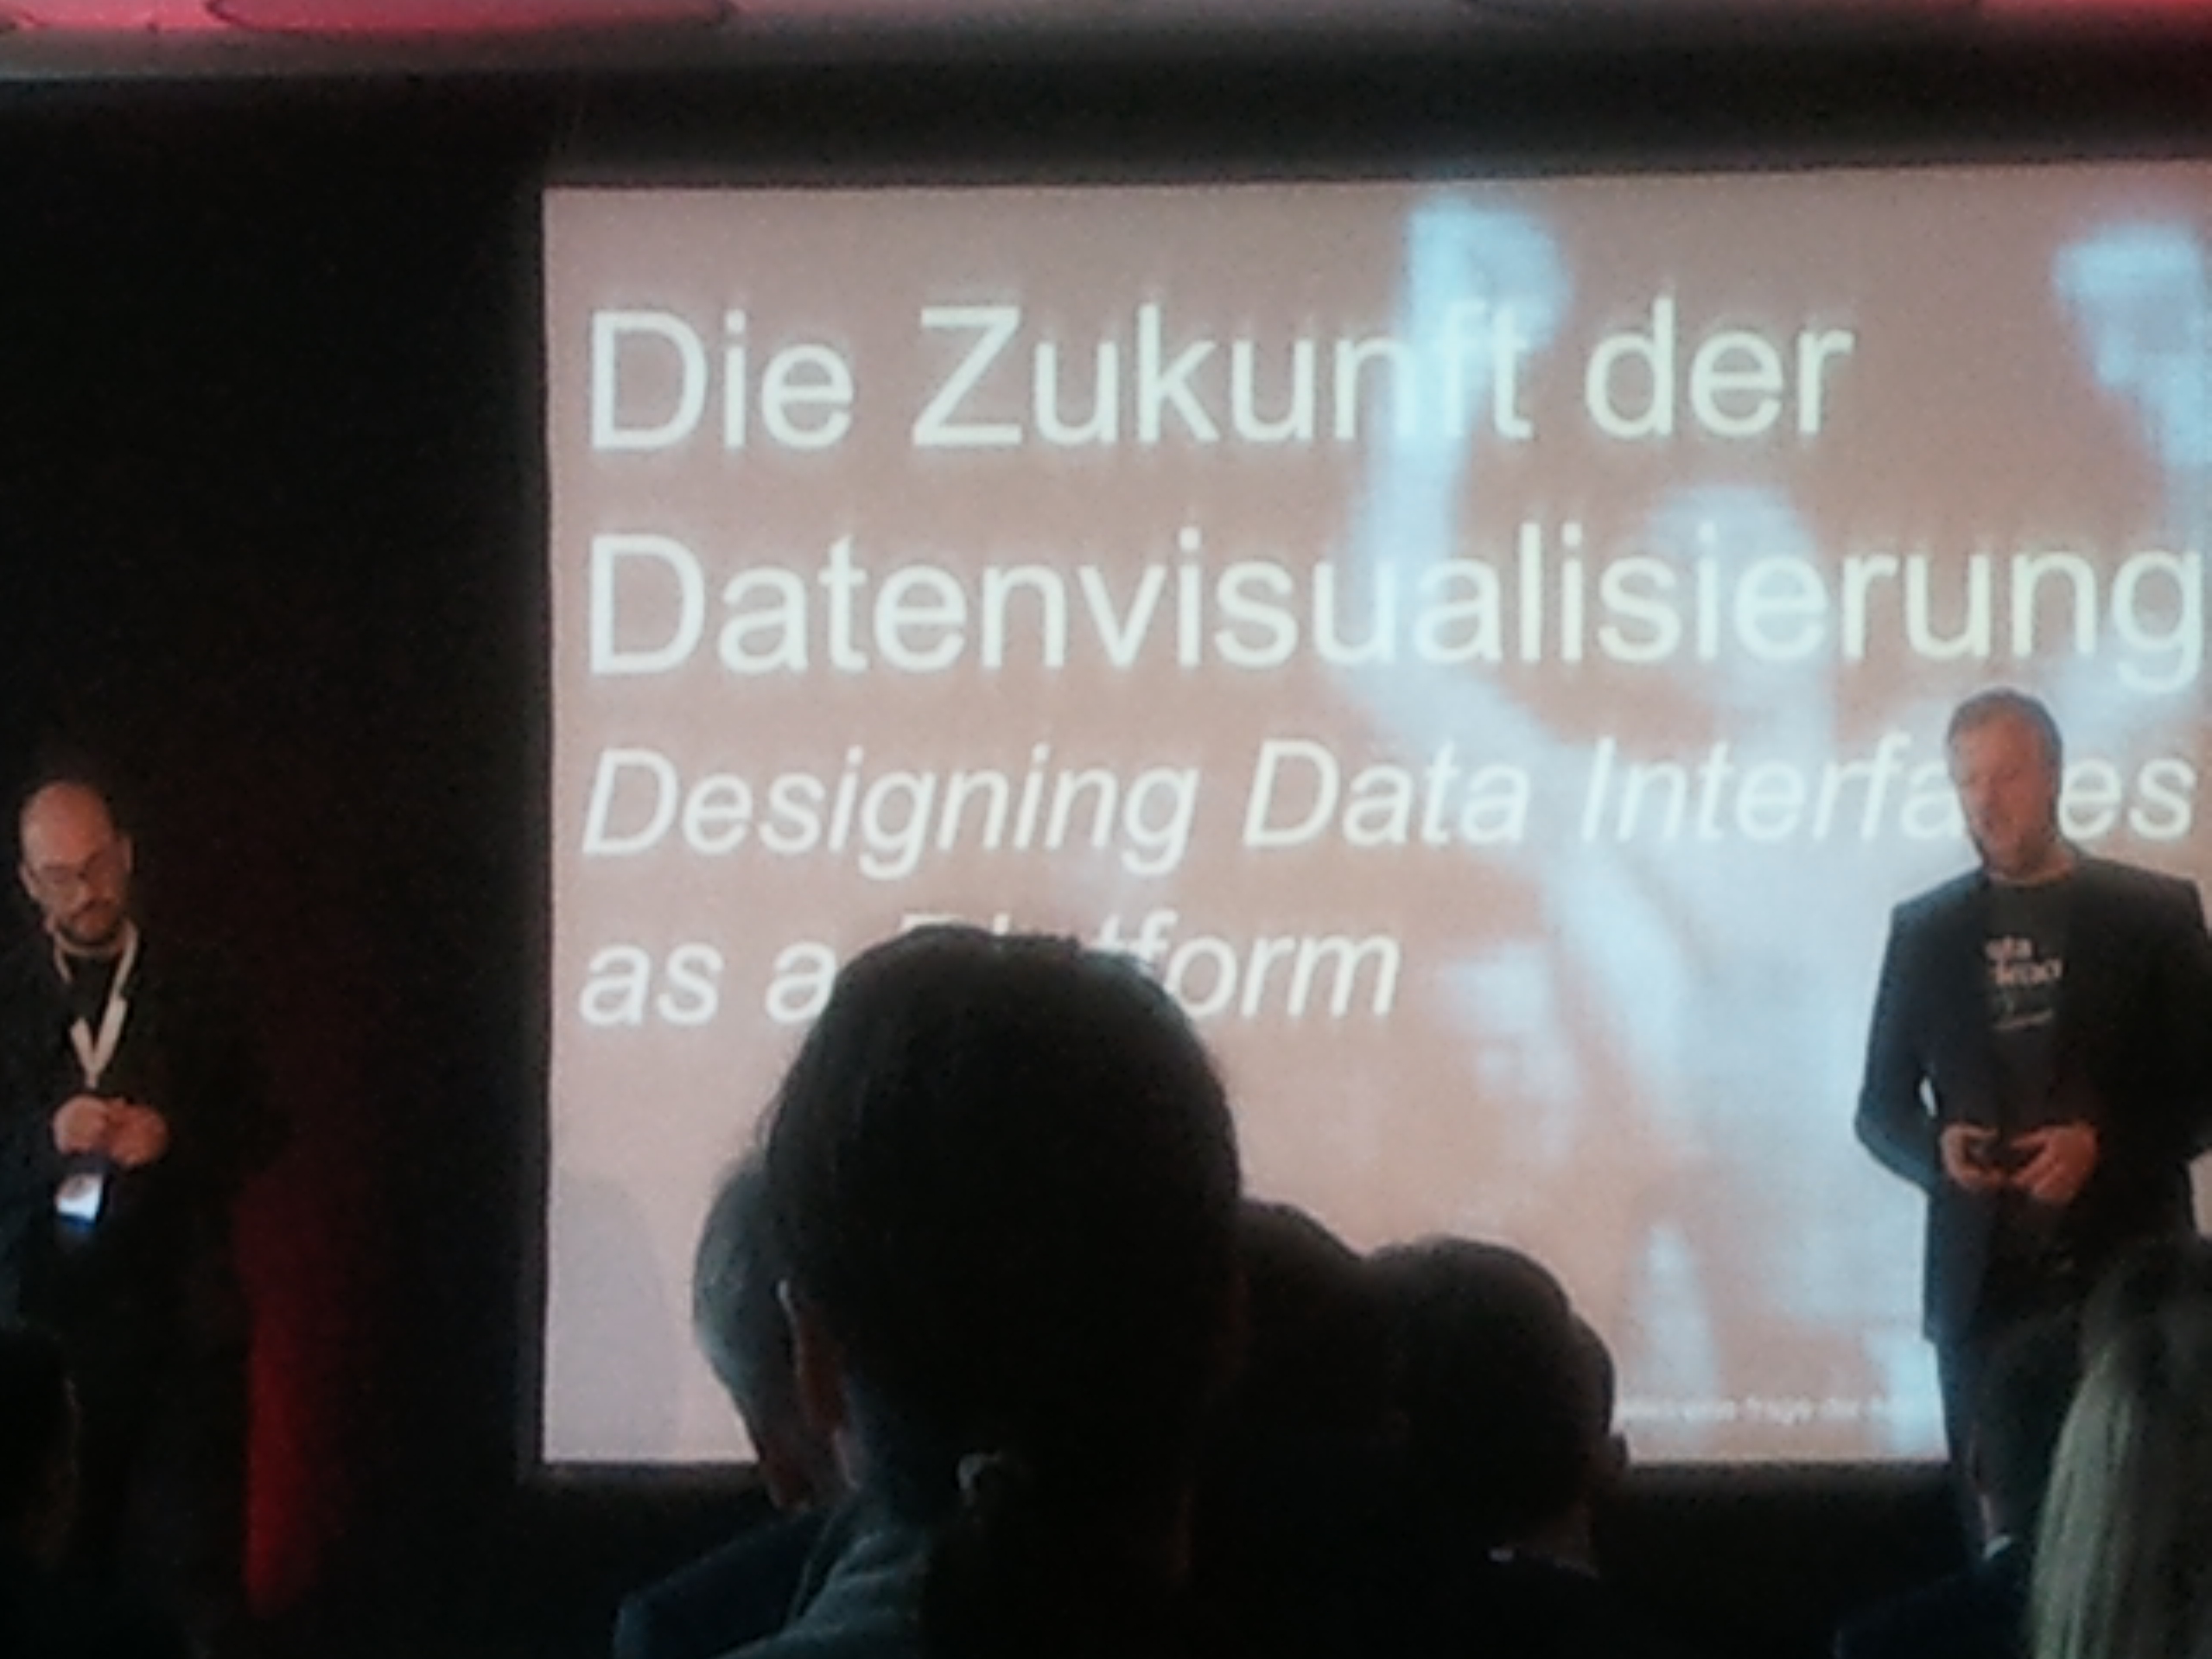
Klaas Bollhoefer from The Unbelievable Machine and Stephan Thiel from StudioNAND held a furious plea for taking the user interface for big data more serious. At the moment, it was still the case that a lot of effort (and budget) is spent on data aggregation, storage, processing, etc. “With an additional 5.000 bucks we create some interface, at the end.” was a common attitude. Bollhoefer found this particularly ill balanced and counter productive for an effective use of information. Obviously, the decisive people in companies knew too few about visualization and design, and thought too little about the eventual users of such a system.

WP_000389

One important feature for analysis tools was direct manipulation of the data and an immediately updating visualisation (think of Bret Victor): this way, the user can try out various deviating values and play through a couple of “what if”-scenarios: such as “if we get a higher conversion rate on our webshop, what would that mean for our profits”. This is something that also otherwise well designed products such as Google Analytics don’t provide yet.

Unfortunately, Klaas and Stephan hardly showed any examples of systems that work that way, from data visualization or other domains. I couldn’t agree more to their statements but some more visuals would have made it far more compelling to the hardly design-literate audience.


From the exhibiting companies, splunk and tableau showed very promising tools that took many of these demands into account. splunk keeps you close to the “raw” data but provides a variety of mini-statistics and context tools that provides the user with a quick understanding of the data set and puts her in control.

tableau, a Stanford viz group spin off, has a drag-n-drop operated interface for data manipulation and super quick access to a wide variety of visualizations to try and to combine. Both stated that they had found new insights in data of their clients within hours, thanks to their tools.


Data ethics and privacy

Big data is keen on data, of course, so the collection or origins of this data might be a little off radar. This was certainly true for the Best in big data-congress. Unintentionally, a video by IBM raised these thoughts: it was asking questions like “Do you know my style? Do you know what I’m buying?” Obviously, it wanted to make the case for more profiling of consumers by means of big data. But questions went on like “Do you know that I tweet about you right now?” and ended in “Know me.”

“… powered by NSA” commented Wolfgang Hackenberg, lawyer and member of Steinbeis transfer center pvm. Despite some awareness of the privacy topic, his talk unfortunately didn’t get to the real dilemmas, let alone proposed solutions. In a huge talk/article from 2012, danah boyd pointed out that taking personal information and statements out of context is very often per se already violating privacy: people make statements in contexts that they understand and find appropriate. If you remove or change the context, a statement might be embarassing or otherwise open for misinterpretation. Big data collection methods tend to be highly susceptible for this offending behaviour – hence, people feel uneasy about it. Hackenberg admited that he doesn’t want to be fully screened himself and that big data for personal information necessarily means the “transparent user”. But he also found strict German and European legislation on privacy simply a burden in international competition for all companies in this domain.

One way could be to involve the “data sources” more in this process and offer them the results of the data analysis. But as I mentioned above, consumer facing ideas were very rare. There is room for improvement.


WP_000387

A remarkable feature of the congress was the venue, inside the Frankfurt Waldstadion (soccer stadium): all breaks allowed the audience to step out of the room and enjoy the sun in the special atmosphere on the ranks of the stadium: a big room for big thoughts.


Tags: , , ,

“Potsdamer Konferenz für Nationale Cybersicherheit”

On Tuesday, 4th of June, the “Potsdamer Konferenz für nationale Cybersicherheit” took place at the Hasso-Plattner Institute in Potsdam, Germany. The main goal of the conference was to improve the communication between the government, economy and the different research fields in the issue of cyber-security. For us, it was interesting in two ways: finding the main actors to focus on in our research and learning how the current security situation is rated by the different organisations.

hpi

 The conference started with a few words of welcome from Director and CEO of the Hasso-Plattner Institute, Prof. Dr. Christoph Meinel. In his short Keynote, which was mostly about the work and research of the HPI IT-Security Engineering Team, he also introduced the audience to the new HPI-Vulnerability-Database.

The HPI-VDB portal is the result of research work being conducted by IT-Security Engineering Team at Prof. Christoph Meinel’s chair “Internet Technologies and Systems” at HPI. It is a comprehensive and up-to-date repository which contains a large number of known vulnerabilities of Software. The vulnerability information being gathered from Internet is evaluated, normalized, and centralized in the high performance database. The textual descriptions about each vulnerability entry are grabbed from the public portals of other vulnerability databases, software vendors, as well as many relevant public web pages, etc. A well-structured data model is used to host all pieces of information which is related to the specific vulnerability entry. Thanks to the high quality data serialized in the high performance In-Memory database, many fancy services can be provided, including browsing, searching, self-diagnosis, Attack Graph (AG), etc. Additionally, we offer many types of API for IT developers to leverage our database for their development. (http://www.hpi.uni-potsdam.de/meinel/security_tech/hpi_vdb.html)

panel

A lot more interesting speakers have been invited to talk from their perspective of cyber security. For example the director of the European Network and Information Security Agency (ENISA) Prof. Udo Helmbrecht made a keynote speech addressed to policy- and decision-makers such as the Bundesland Brandenburg-Ministerpräsident, the Federal Minister, as well as industry representatives and others.

In Focus of our research, this conference was not the very best place to lern new things. But the possibility to make new contacts and meet interesting people in generell was great and we now have a few names to work with in the future time. Also the knowledge of the actors and so called: “big player” in the business is good to have.

A short film about the conference was uploaded on youtube. This video was made by hpi tv and sums up the conference pretty well. (GER only)

Tags: , , ,

Security Log Visualization with a Correlation Engine

On the 28th Chaos Communication Congress organized by Chaos Computer Club in Berlin, network security specialist Chris Kubecka talks about how correlation and visualization of network log data from different devices can support the process of finding potential threats and malware. Usually a network is comprised of a variety of different devices that each generates log files in its own format. Having a separate console for each of these devices

Tags: , , , , , ,