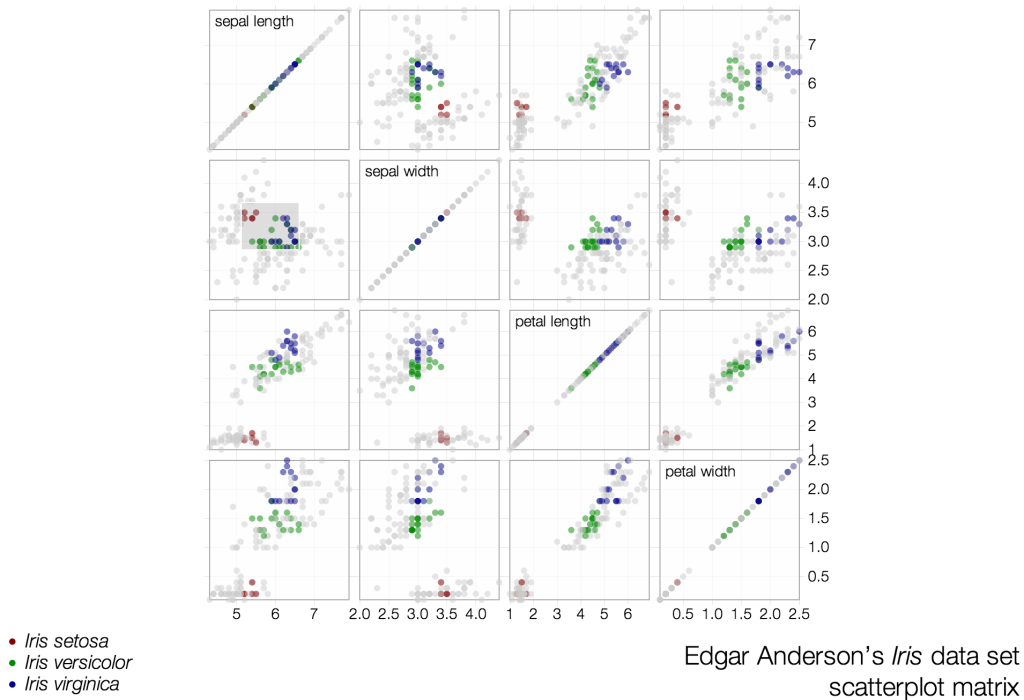
The scatterplot matrix visualizations from Mike Bostock match each row within the dataset against each other. By choosing a range within one matrix all selected data-points within each cell gets highlighted.
The scatterplot matrix visualizations from Mike Bostock match each row within the dataset against each other. By choosing a range within one matrix all selected data-points within each cell gets highlighted.