In this project Australian data visualization firm dataviz Australia shows the early stages of an attack on a honeypot VoIP server extension. This animation is based on real data and was created with a Ruby-based tool called gltail. The attack is represented by the circles coming in from the right side meeting the defense of the server in the middle, represented by the circles coming from the left side.
Tags: attack, network, security, visualization22 posts Posts by admin
Tableau Software
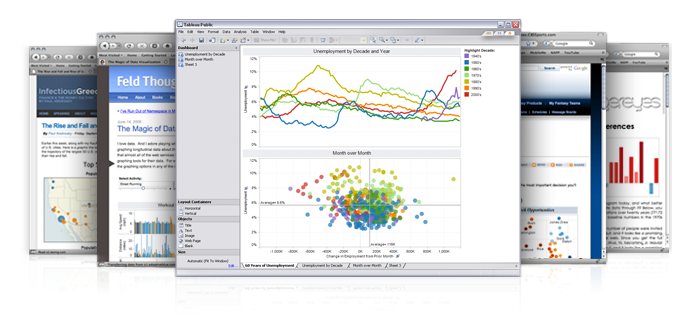 Tableau is a software that provides companies and private users with a simple tool to create basic interactive graphs like maps, bar and line charts, heat maps and other from uploaded data files. There are different versions of the software for different use cases. You can use a desktop version to look at your data or you can create interactive graphics for the web and combine modules to form a dashboard, for example, to keep track of the development of a company’s business.