5 articles Tag graph

Stanford Dissertation Browser

Stanford-Dissertation-Browser-electrical-engineering-625x608
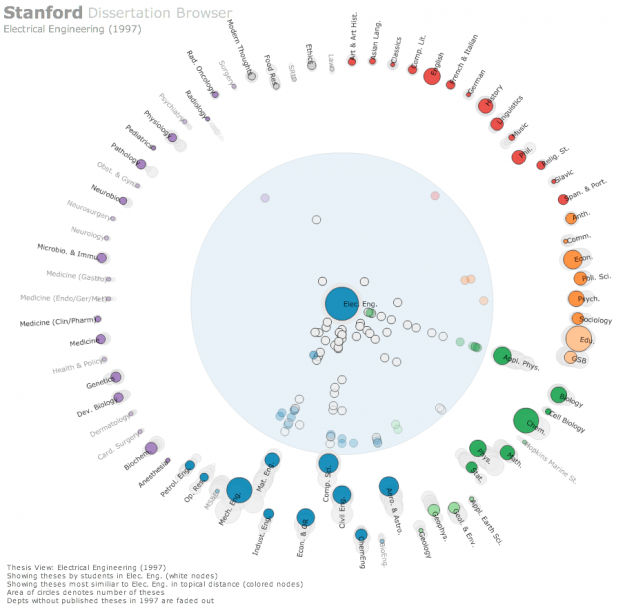
The Stanford Dissertation Browser is an interactive tool to explore similarities between different fields of study at Stanford University by examining the language used in the different PhD publications. Fields of study are arranged around a circle with one field of study in the centre. For the subject in the centre similarities with other fields are shown by the distance to the centre. The closer the circles, the more common the language these fields share.

For example, if you select Electrical Engineering the field Computational Science will move close to the centre, which is not a big surprise. When selecting Music, however, Computational Science also moves very close to the centre. Something you might not expect, at least not to this degree. With a slider at the bottom different years can be selected. The different years are shown all the time in the diagram by very subtle grey circles, which display year and field of study, if you hover over them. In this way you get an overview over the distribution over time and can get more details by moving the timeline slider to select specific years.

This way of visualizing a network is similar to the method the research group Research on Complex Systems at Northwestern University used in their visualization of the structural change in the international flight network. In a similar manner, one particular node was put into focus, surrounding nodes being closer to this node when these two nodes were strongly connected by many links. The same ist the case with the different fields of study. The more words they share, the more connections or links are there between these fields, moving them closer together.

Tags: , , , , , , , ,

Visualizing connectivity of airports during Eyjafjallajökull eruption

Eyjafjalljökull2 The Engineering Sciences and Applied Mathematics department at Northwestern University hosts several research projects that deal with complex networks. One of these projects deals with the effect of the ash cloud covering Europe in April 2010 for several days. The reaearch group tried to shed light on the question in what way the event has changed the structure of the complex network that is formed by the flight connections by all the airports around the world. The way they did this was not by looking at the overall topology of the network, but rather by looking at single nodes, the different airports, and calculating their shortest-path length before and after the eruption. The shortest path doesn’t describe the geographical distance between two airports, but rather the connectivity between them. So the more flights occur between two airports, the shorter is its path.

These calculations are shown in a special kind of circular before-after diagrams with one particular airport in the centre of a red circle surrounded by dots that represent all the airports that are connected. It is not clear what exactly the red circle describes. According to the website it is the “approximate distance of the world from Atlanta”. However, it is clearly some kind of threshold. Looking at Atlanta airport before the event we can see that there are several airports within the red circle, mostly North-American, but also some big others like Frankfurt, London or Hongkong. After the event, however, these have been pushed out of the circle, while in general most of the other nodes have been pushed further away from the circle, thus increasing their shortest-path length.

Tags: , , , , , ,

HP Enterprise Security Products and ArcSight

ArcSight ESM DashboardIn their business unit ESP (Enterprise Security Products) Hewlett Packard offers several security tools in three different areas: Application Security (Fortify), Information Security (ArcSight) and Network and Cloud Security (Tipping Point). While Fortify is targeted at software security, ArcSight can be considered a SIEM (Security Information and Event Management) system. TippingPoint is a defense system against cyber attacks and threats.
According to Gardner ArcSight can be considered as one of the leaders in the field of SIEMs. There are different ArcSight SIEM solutions available depending, if you are  interested in recording and analyzing log information or if you are focussing on real-time security events. The choice for one of the solutions is also dependent on the size of your network.

Though ArcSight is one of the most popular products on the market on the market it has its shortcomings:

“ArcSight Enterprise Security Manager is complex in terms of deployment and performance management.”

Tags: , , , , , , , ,

How States Have Shifted

swing states

With a flow diagram the New York Times shows how the votes of the different states in the USA changed from one presidential election to the other. By hovering over single states their flow is highlighted while the other states are grayed out. The x-scale describes how many percent of the votes were gained or lost for a party in one election, so if there was a big change, the lines literally “swing”. The thickness of the lines is proportional to the number of electoral votes one state has.

Tags: , , , , , , ,

Tableau Software

TableauTableau is a software that provides companies and private users with a simple tool to create basic interactive graphs like maps, bar and line charts, heat maps and other from uploaded data files. There are different versions of the software for different use cases. You can use a desktop version to look at your data or you can create interactive graphics for the web and combine modules to form a dashboard, for example, to keep track of the development of a company’s business.

Tags: , , , , , ,