11 articles Tag web

Google+ Ripples

Google+ Ripples is a visualization of the spread of public posts in the social network Google+. Signed-up members of Google+ can select any public post and have a look at the spread of the post through the network. Only reposts that are set to public are shown in this visualization, so the visualization doesn’t show the reposts of people in their private circles.
The selected post is shown in the middle of the visualization. Reposts are represented by circles labeled with the person’s name that shared the post. Arrows show which person shared which post. If a shared post is shared again, the shared’s post circle becomes bigger. The spread of a message over time can be observed by using the timeline slider at the bottom of the diagram. It is also possible to zoom into diagram, which becomes very helpful when looking at posts that were reposted a lot of times.
The circles have different colors assigned, though it is not clear to me, what these are expressing.

I think generally this is an interesting approach of visualizing “contagion” in a network. It clearly identifies people that are more “contagious” than other people, which could be explained by these people having more social ties in the social network, having something like a leadership role or it could just mean that these people’s friends are more interested in the topic than other people’s friends that didn’t reshare their post. The zoomable user interface is a good way of providing focus and context by interaction. It allows for quite large numbers of elements to be displayed hiding detail information when it is zoomed out, providing more and more information with every zoom-in step.
Some aspects of the interface are worth discussing: For example, why do the circles of reshared posts have to be that large taking away a lot of space? Posts that reshare a post don’t necessarily have to be inside the circle. Also the interface could show all the reposts including the privately shared without providing the name of the sharing person.

Tags: , , , , , , , ,

Stanford Dissertation Browser

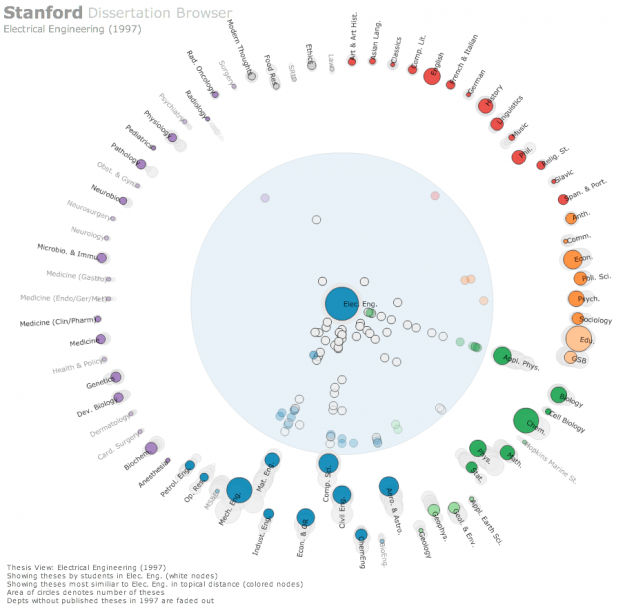
Stanford-Dissertation-Browser-electrical-engineering-625x608The Stanford Dissertation Browser is an interactive tool to explore similarities between different fields of study at Stanford University by examining the language used in the different PhD publications. Fields of study are arranged around a circle with one field of study in the centre. For the subject in the centre similarities with other fields are shown by the distance to the centre. The closer the circles, the more common the language these fields share.

For example, if you select Electrical Engineering the field Computational Science will move close to the centre, which is not a big surprise. When selecting Music, however, Computational Science also moves very close to the centre. Something you might not expect, at least not to this degree. With a slider at the bottom different years can be selected. The different years are shown all the time in the diagram by very subtle grey circles, which display year and field of study, if you hover over them. In this way you get an overview over the distribution over time and can get more details by moving the timeline slider to select specific years.

This way of visualizing a network is similar to the method the research group Research on Complex Systems at Northwestern University used in their visualization of the structural change in the international flight network. In a similar manner, one particular node was put into focus, surrounding nodes being closer to this node when these two nodes were strongly connected by many links. The same ist the case with the different fields of study. The more words they share, the more connections or links are there between these fields, moving them closer together.

Tags: , , , , , , , ,

Fighters in a Patent War

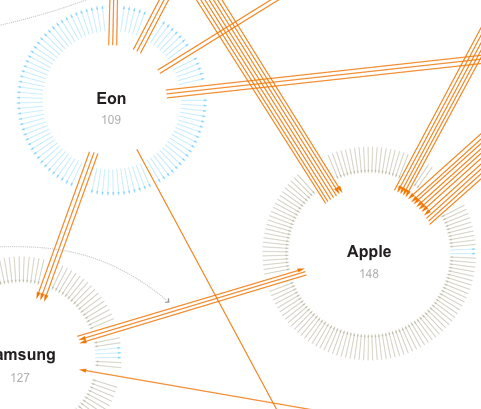
PatentWarsThis network visualization by the New York Times shows patent suits of the ten biggest actors (like Apple, Samsung, Motorola etc.) in the mobile phone market. Suits between these ten companies are represented by orange arrows, while suits against one of the ten companies by other parties are colored grey and suits of one company against other parties have a blue color. These other parties are not more specifically detailed. The total amount of different arrows one company has are arranged in a circle with the effect that the cirle becomes bigger, the more incoming or outgoing suits one company has.

This visualization caught my attention primarily because of the arrangement of the arrows. Thinking of computer networks different segments of the circle could visually encode different ports and their connections in a network. Further research is needed to investigate, if this might prove helpful for security administrators.
Also, for such a visualization it might be more revealing to put more emphasis on the direction of the connections, e.g. by color. Differentiating the direction only by the little arrowhead, as we can observe in the New York Times graphic is a little hard to recognize. For applications such as monitoring a network these kinds of weak differentiations are not enough.

Tags: , , , , ,

The Power Rank

ThePowerNode

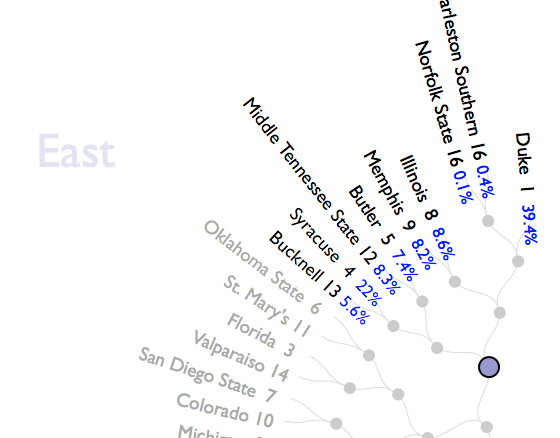
The Power Rank is a visualization of the chances of winning for all the basketball teams participating in the NCAA Tournament. The teams are organized around a circle grouped by the region they are from. In the center of the circle you can see all the games of the tournament represented by dots. These are connected to the different teams that could possibly take part in the game. When hovering over these dots, the teams get highlighted  and the probability of being the winner of this particular game is shown at the team’s label with a percentage value. You can also hover over particular teams to show what the corresponding chances of winning are in the different games leading to the final (which is the dot in the middle).

This visualization is rather uncommon in that it shows a hierarchy in the middle of the circle with a treelike structure. Of course this is a visualization that can handle only a certain amount of data because the space is limited by the circle.

Tags: , , , , , , ,

CNN Ecosphere

The CNN Ecosphere is an interactive visualization of tweets about the COP17 Conference on Climate Change in Durban, South Africa. Tweets with the hashtag #COP17 are organized in threedimensional trees around a globe. The different discussed topics are split into different trees with each tweet being a leaf in the tree. Depending on how the discussion develops over time, growth in the trees is stimulated more or less. By clicking and dragging the globe and the trees can be turned around. There is a timeline slider at the bottom to select a certain day in the past. Also, Different topics can be selected at the bottom. Clicking them automatically zooms in to these trees. When a tree is zoomed in, the each tweet can be read by hovering over the leaves.
While the visualization is quite impressive and beautiful, the interface is very limited and the overall performance of the app is rather slow.

ecosphere 1

Tags: , , , ,

Splunk

splunk_dashboard 2 splunk_dashboard

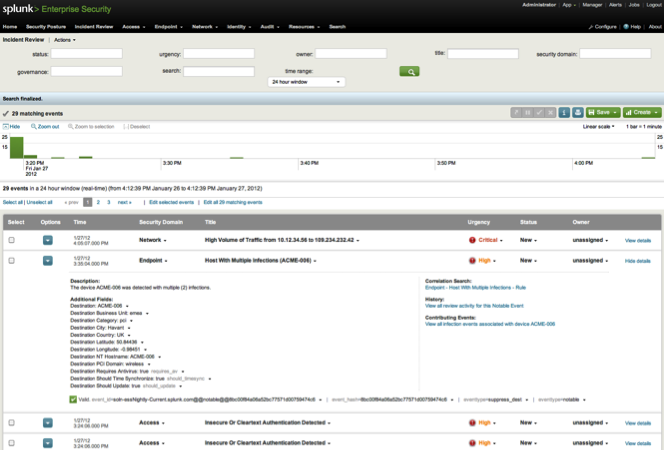
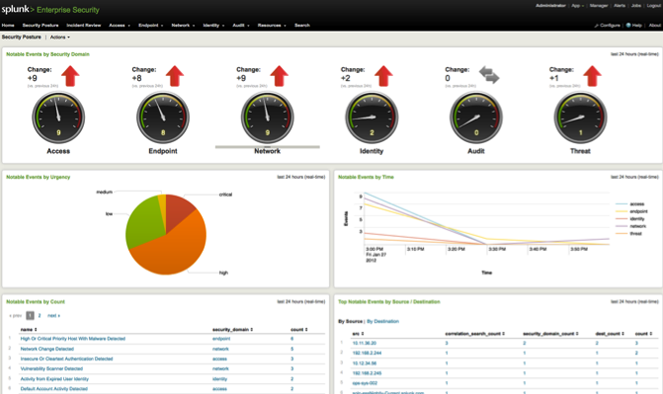
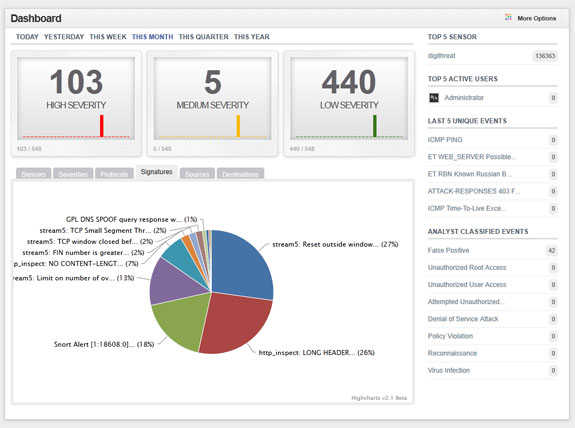
Splunk is a general tool for analysing data in huge IT infrastructures. It consists of different tools that can be utilized in different contexts. With the “Splunk App for Enterprise Security” potential threats and security incidents can be observed, analysed and classified. Users of the app are presented with a web dashboard that visualizes different aspects of the network.

Tags: , , , , , , , , , ,

Snort – Intrusion Detection System

snorby2

BASE

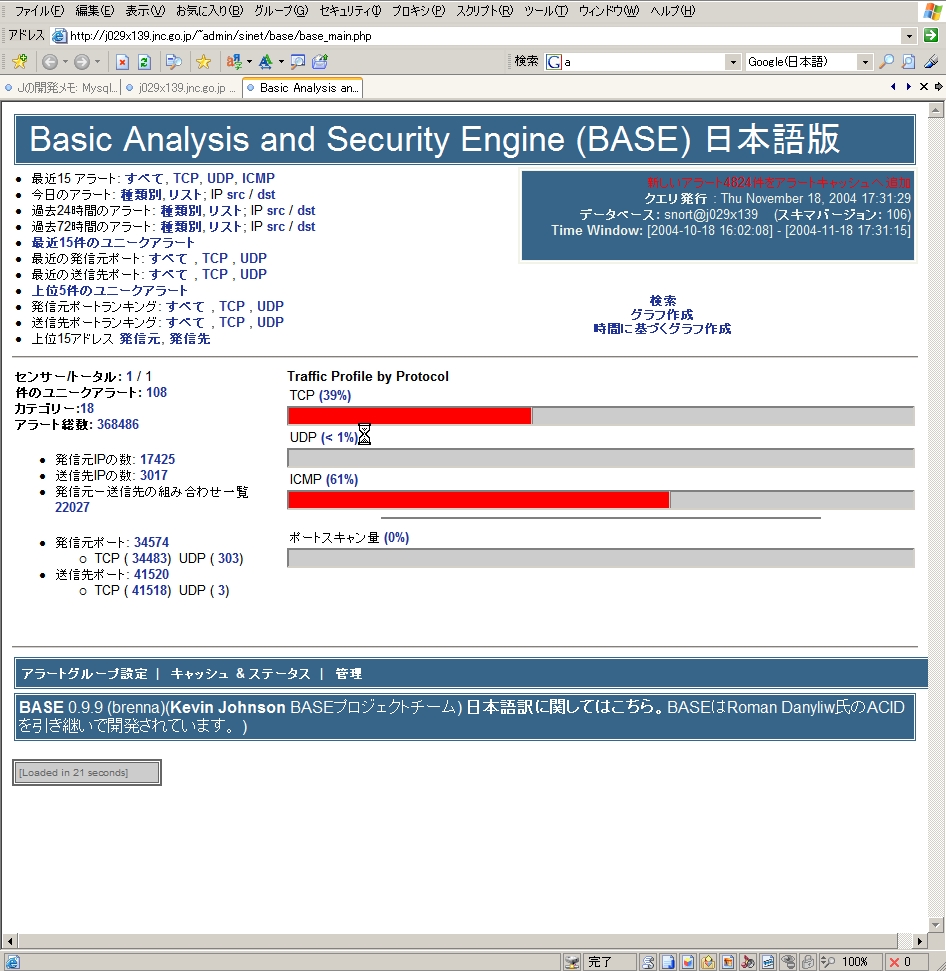
Snort is an open source intrusion detection/prevention system (IDS/IPS) developed by Sourcefire. It is the most used IDS/IPS worldwide. Snort alone has no GUI to interact with, but it’s possible to connect several other Network Security Monitoring systems with it, like Snorby, BASE, OSSIM.

Tags: , , , , , , ,

ACARM WUI

ACARM_Heatmap

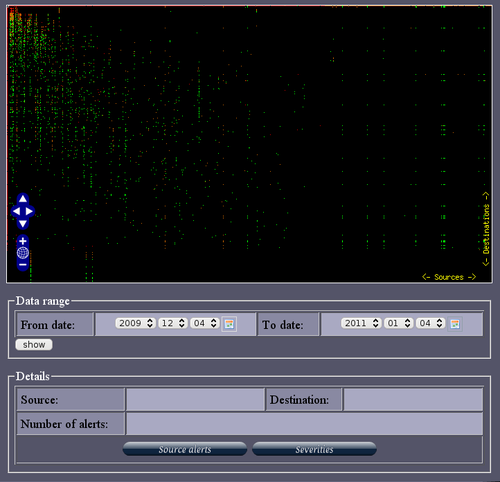
ACARM (Alert Correlation, Assessment and Reaction Module) is a tool that correlates alerts sent by host and network sensors into groups and in that way reducing the amount of messages that need to be viewed by a sytem administrator. There is a Web GUI that let’s the admin observe the different kinds of alerts with different graphical representations like, for example, pie charts, bar charts or more advanced. Different kinds of alerts are color coded on a color scale from green to red, green being just information, while red being critical.

Tags: , , , , , , , ,

The Observatory

theObserver

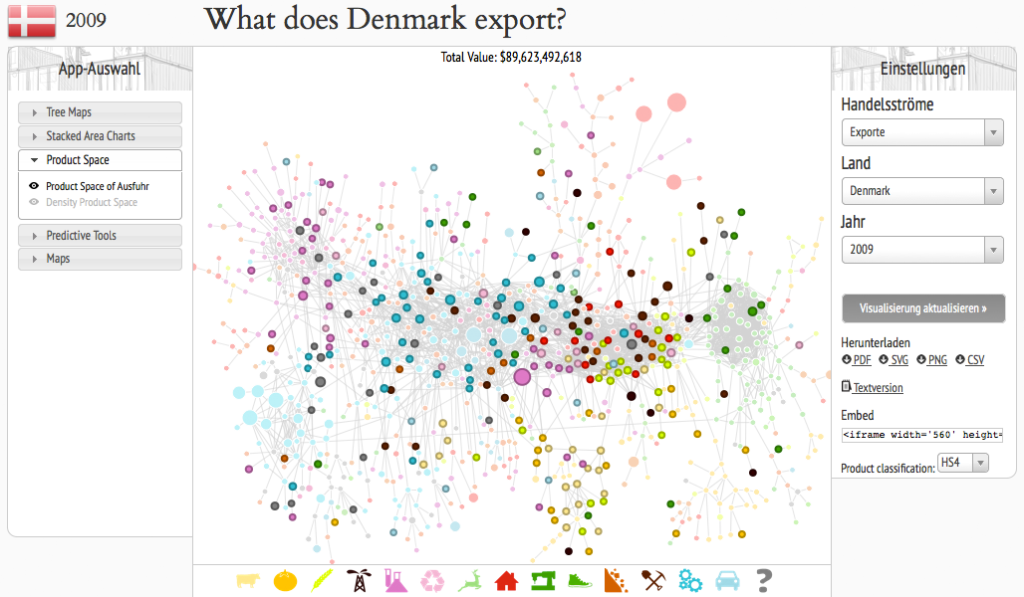
The observatory is a Web-App that allows you to view the the economic situation of different countries by applying different visualizations to the data and as the creators state: “a tool that allows users to quickly compose a visual narrative about countries and the products they exchange”. The user has the choice between treemaps, network node diagrams, stacked area charts, maps, for example. The user can get an overview about imports and exports of single countries, either by amount in a treemap or by time in a stacked area chart. In a network node diagram it can be observed how products are connected wioth each other. Also, products can be put into focus by showing the total export of a product and how much of the product different countries exported. The interface is a bit clunky, there is no strict information hierarchy, so sometimes you don’t realize what exactly you’re looking at at first glance.

Tags: , , , ,

How States Have Shifted

swing states

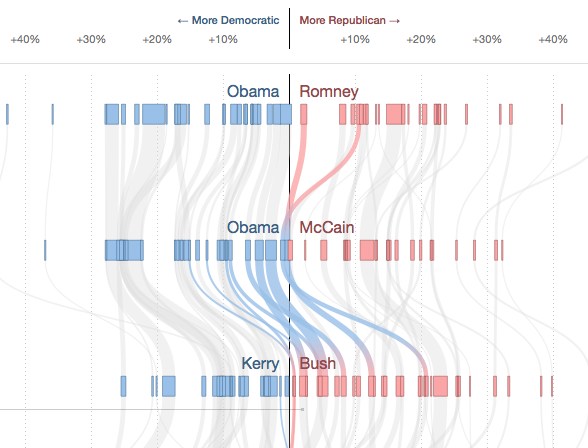
With a flow diagram the New York Times shows how the votes of the different states in the USA changed from one presidential election to the other. By hovering over single states their flow is highlighted while the other states are grayed out. The x-scale describes how many percent of the votes were gained or lost for a party in one election, so if there was a big change, the lines literally “swing”. The thickness of the lines is proportional to the number of electoral votes one state has.

Tags: , , , , , , ,