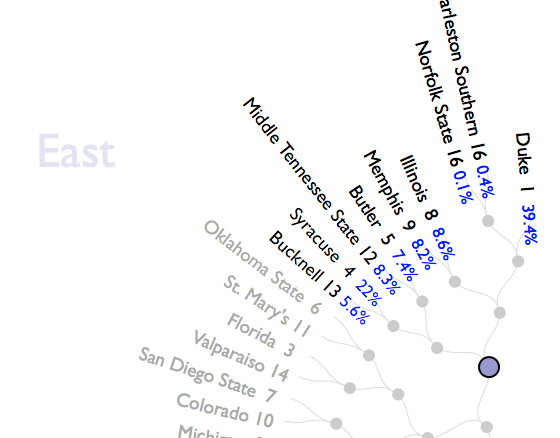
The Power Rank is a visualization of the chances of winning for all the basketball teams participating in the NCAA Tournament. The teams are organized around a circle grouped by the region they are from. In the center of the circle you can see all the games of the tournament represented by dots. These are connected to the different teams that could possibly take part in the game. When hovering over these dots, the teams get highlighted and the probability of being the winner of this particular game is shown at the team’s label with a percentage value. You can also hover over particular teams to show what the corresponding chances of winning are in the different games leading to the final (which is the dot in the middle).
This visualization is rather uncommon in that it shows a hierarchy in the middle of the circle with a treelike structure. Of course this is a visualization that can handle only a certain amount of data because the space is limited by the circle.