On the 28th Chaos Communication Congress organized by Chaos Computer Club in Berlin, network security specialist Chris Kubecka talks about how correlation and visualization of network log data from different devices can support the process of finding potential threats and malware. Usually a network is comprised of a variety of different devices that each generates log files in its own format. Having a separate console for each of these devices
Tags: attack, conference, security, SIEM, talk, tool, visualization5 articles Tag attack
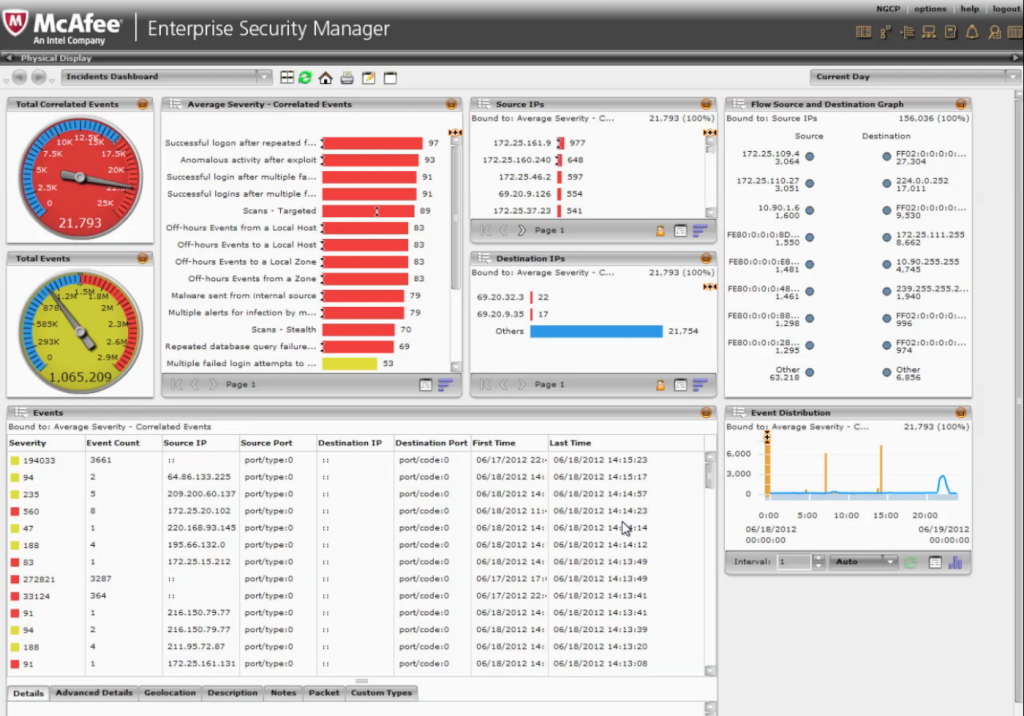
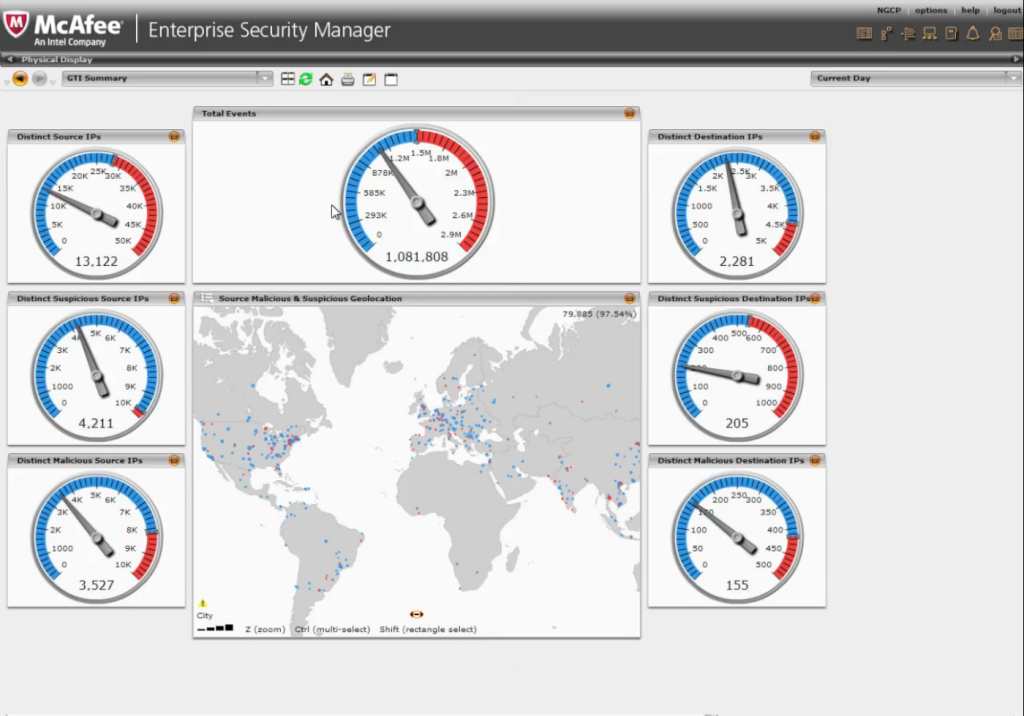
Enterprise Security Manager (McAfee)
McAfee NitroSecurity is a software that offers SIEM functionality and log management in one single tool separating it from other SIEM systems. It is scalable and has a high performance, which makes it especially useful for organizations that need to analyse huge numbers of events. The company itself emphasizes the speed of the product as an outstanding feature. It is one of the five products positioned as leader in the Magic Quadrant for Security Information and Event Management.
Tags: alerts, attack, commercial, dashboard, network, security, SIEM, toolSplunk
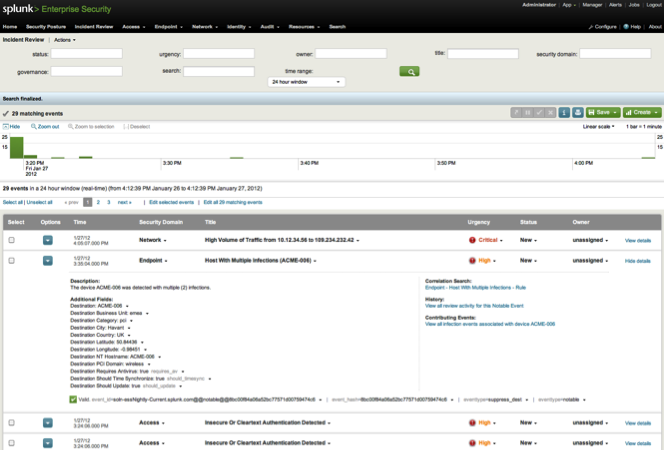
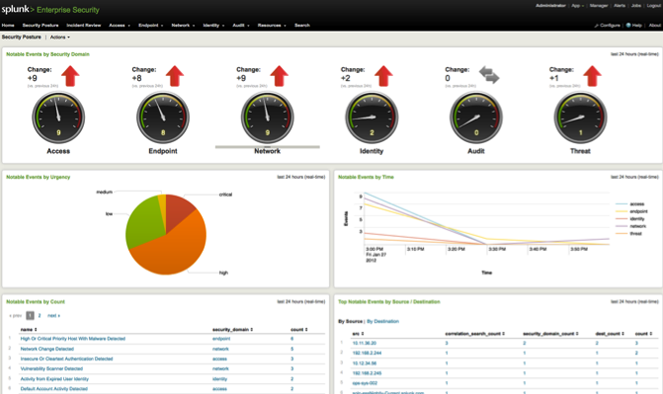
Splunk is a general tool for analysing data in huge IT infrastructures. It consists of different tools that can be utilized in different contexts. With the “Splunk App for Enterprise Security” potential threats and security incidents can be observed, analysed and classified. Users of the app are presented with a web dashboard that visualizes different aspects of the network.
Tags: alerts, attack, commercial, dashboard, diagram, interface, network, security, tool, visualization, webACARM WUI
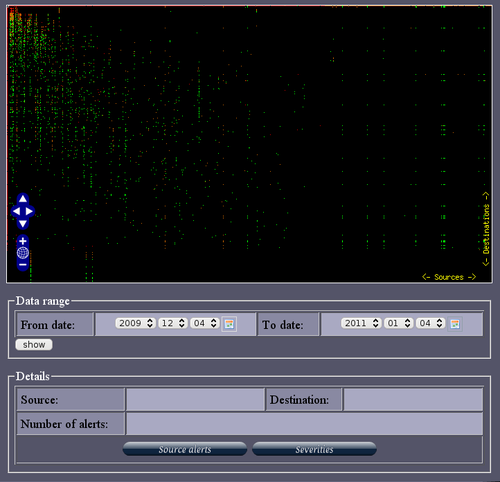
ACARM (Alert Correlation, Assessment and Reaction Module) is a tool that correlates alerts sent by host and network sensors into groups and in that way reducing the amount of messages that need to be viewed by a sytem administrator. There is a Web GUI that let’s the admin observe the different kinds of alerts with different graphical representations like, for example, pie charts, bar charts or more advanced. Different kinds of alerts are color coded on a color scale from green to red, green being just information, while red being critical.
Tags: alerts, attack, heatmap, Interactive, interface, security, tool, visualization, webVisualizing a VoIP Security Attack
In this project Australian data visualization firm dataviz Australia shows the early stages of an attack on a honeypot VoIP server extension. This animation is based on real data and was created with a Ruby-based tool called gltail. The attack is represented by the circles coming in from the right side meeting the defense of the server in the middle, represented by the circles coming from the left side.
Tags: attack, network, security, visualization
