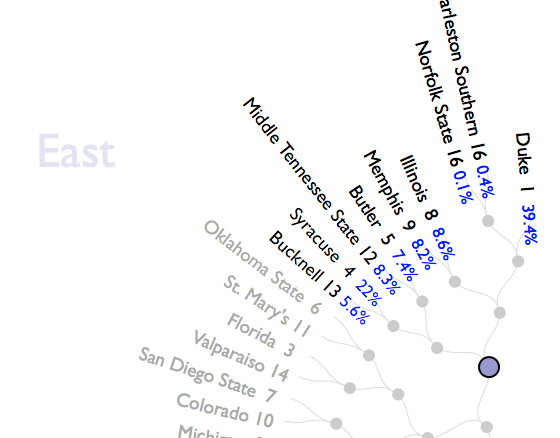
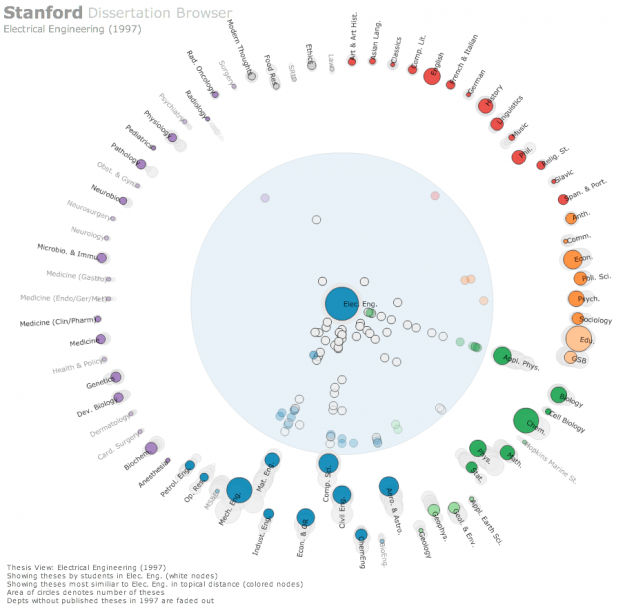
 The Stanford Dissertation Browser is an interactive tool to explore similarities between different fields of study at Stanford University by examining the language used in the different PhD publications. Fields of study are arranged around a circle with one field of study in the centre. For the subject in the centre similarities with other fields are shown by the distance to the centre. The closer the circles, the more common the language these fields share.
For example, if you select Electrical Engineering the field Computational Science will move close to the centre, which is not a big surprise. When selecting Music, however, Computational Science also moves very close to the centre. Something you might not expect, at least not to this degree. With a slider at the bottom different years can be selected. The different years are shown all the time in the diagram by very subtle grey circles, which display year and field of study, if you hover over them. In this way you get an overview over the distribution over time and can get more details by moving the timeline slider to select specific years.
This way of visualizing a network is similar to the method the research group Research on Complex Systems at Northwestern University used in their visualization of the structural change in the international flight network. In a similar manner, one particular node was put into focus, surrounding nodes being closer to this node when these two nodes were strongly connected by many links. The same ist the case with the different fields of study. The more words they share, the more connections or links are there between these fields, moving them closer together.
Tags: graph, infosthetics, Interactive, interface, network, science, tool, visualization, web
 The
The  This network visualization